Microsoft Excel: Comprehensive Tutorial and Guide
Introduction
Microsoft Excel is a powerful spreadsheet application that allows users to organize, analyze, and visualize data. It is widely used in various industries, including finance, business, accounting, and data analysis. This comprehensive tutorial provides a step-by-step guide to the essential features and functionality of Microsoft Excel.
Getting Started
- Open Excel: Launch the Microsoft Excel application from the start menu or your desktop.
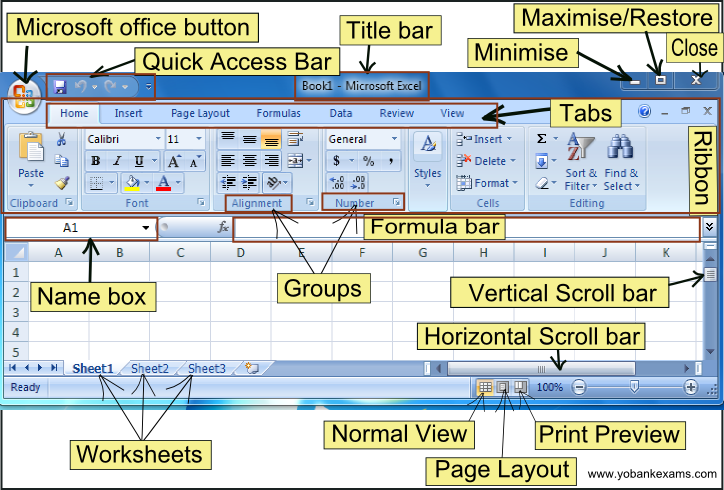
- Create a New Workbook: By default, a new workbook with three empty worksheets will open.
- Worksheet: Each new workbook contains multiple worksheets, which are the primary area for data entry and manipulation.
Data Entry and Management
- Cells: Individual units of data are stored in cells, which are identified by their column and row coordinates (e.g., A1, B2).
- Data Types: Excel supports various data types, including text, numbers, dates, and formulas.
- Formulas: Formulas allow you to perform calculations and automate data manipulation. Use the equal sign (=) at the beginning of a cell to create a formula.
- Functions: Excel provides a wide range of built-in functions for performing common calculations and manipulations, such as SUM, AVERAGE, and IF.
Data Organization and Formatting
- Sorting and Filtering: Organize data by sorting or filtering it based on specific criteria.
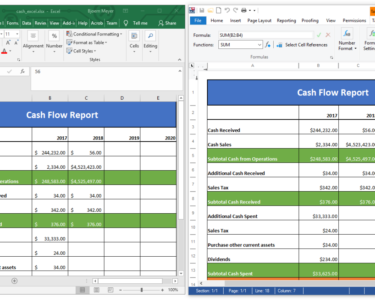
- Conditional Formatting: Apply different formatting styles to cells based on specified conditions, such as highlighting cells that exceed a certain value.
- Data Validation: Set rules to restrict data entry to specific formats or ranges.
Data Visualization
- Charts: Create various chart types, including line graphs, bar charts, and pie charts, to visualize data.
- Pivot Tables: Summarize and analyze large datasets by creating pivot tables.
- Conditional Formatting: Use conditional formatting to highlight important trends or patterns in data.
Collaboration and Sharing
- Sharing Workbooks: Collaborate with others by sharing workbooks over a network or cloud storage.
- Co-authoring: Multiple users can work on the same workbook simultaneously.
- Protection: Protect workbooks with passwords or restrict editing permissions.
Advanced Features
- Macros: Automate repetitive tasks by using Visual Basic for Applications (VBA) scripts.
- Power Query: Import and transform data from various sources.
- PowerPivot: Create sophisticated data models for advanced analysis.
Tips and Best Practices
- Use Descriptive Cell Names: Assign meaningful names to cells to make it easier to identify and access data.
- Validate Data Regularly: Check the accuracy of data by using data validation rules or manually verifying entries.
- Organize Data Efficiently: Use tables, pivot tables, or slicers to organize and summarize large datasets.
- Automate Tasks: Use macros or functions to reduce repetitive work and save time.
- Seek Support: Consult online forums, documentation, or reach out to experts for assistance when needed.
Conclusion
Microsoft Excel is an indispensable tool for data management, analysis, and visualization. By understanding the fundamental concepts and using the advanced features, users can leverage Excel to maximize their productivity and make informed decisions. This comprehensive tutorial provides a solid foundation for mastering Microsoft Excel and unlocking its full potential.


