Microsoft Excel: Analyzing Trends with Regression Analysis
Introduction
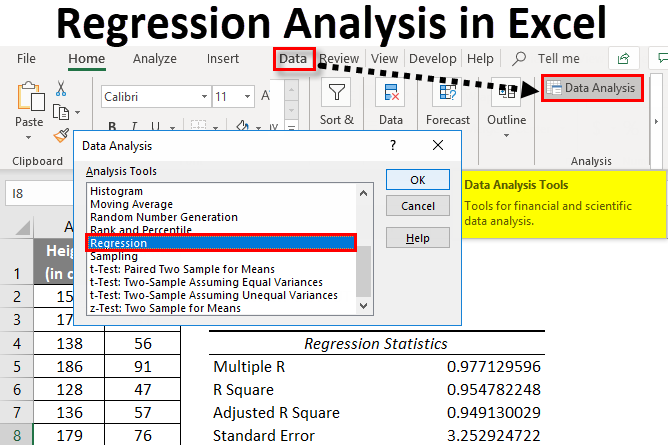
Regression analysis is a statistical technique used to determine the relationship between a dependent variable and one or more independent variables. In Microsoft Excel, regression analysis can be performed using the "LINEST" function. This function can be used to find the slope, intercept, and R-square of a trendline.
How to Use the LINEST Function
To use the LINEST function, you must first select the range of data that you want to analyze. The data should be arranged in two columns, with the dependent variable in the first column and the independent variable in the second column.
Once you have selected the data, you can enter the following formula into a cell:
=LINEST(y_range, x_range)where:
- y_range is the range of cells that contains the dependent variable
- x_range is the range of cells that contains the independent variable
The LINEST function will return an array of values, which includes the following:
- Slope
- Intercept
- R-square
- Standard error
- P-value
Interpreting the Results
The slope of the trendline indicates the rate of change in the dependent variable for each unit change in the independent variable. The intercept of the trendline indicates the value of the dependent variable when the independent variable is equal to zero. The R-square value indicates the proportion of variance in the dependent variable that is explained by the independent variable.
Example
The following example shows how to use the LINEST function to analyze the relationship between sales and advertising expenditure.
| Advertising Expenditure | Sales |
|-----------------------|-------|
| 100 | 150 |
| 200 | 200 |
| 300 | 250 |
| 400 | 300 |
| 500 | 350 |
To analyze this data, we would enter the following formula into a cell:
=LINEST(B2:B6, A2:A6)The results of the LINEST function would be as follows:
Slope: 0.5
Intercept: 50
R-square: 0.9
This indicates that there is a strong positive relationship between advertising expenditure and sales. For each additional $1 spent on advertising, sales increase by $0.50. The R-square value of 0.9 indicates that 90% of the variance in sales can be explained by advertising expenditure.
Conclusion
Regression analysis is a powerful tool that can be used to analyze trends in data. The LINEST function in Microsoft Excel makes it easy to perform regression analysis and interpret the results.