Microsoft Excel: Creating Professional Reports
Microsoft Excel is a powerful tool that can be used to create a variety of professional reports. These reports can be used to track data, present information, and make decisions.
To create a professional report in Excel, you will need to:
- Gather your data. The first step is to gather all of the data that you will need for your report. This data can come from a variety of sources, such as surveys, interviews, or databases.
- Clean your data. Once you have gathered your data, you will need to clean it. This means removing any errors or inconsistencies in the data.
- Organize your data. Once your data is clean, you will need to organize it in a way that makes sense. This may involve creating tables, charts, or graphs.
- Write your report. Once you have organized your data, you will need to write your report. The report should be clear, concise, and well-written.
- Format your report. The final step is to format your report. This includes adding headings, subheadings, fonts, and colors.
Here are some tips for creating professional reports in Excel:
- Use a consistent format. This will make your report easier to read and understand.
- Use clear and concise language. Avoid using jargon or technical terms that your audience may not understand.
- Use visuals to support your data. Charts, graphs, and tables can help to make your data more visually appealing and easier to understand.
- Proofread your report carefully. Make sure that there are no errors in grammar, spelling, or punctuation.
By following these tips, you can create professional reports that will impress your audience.
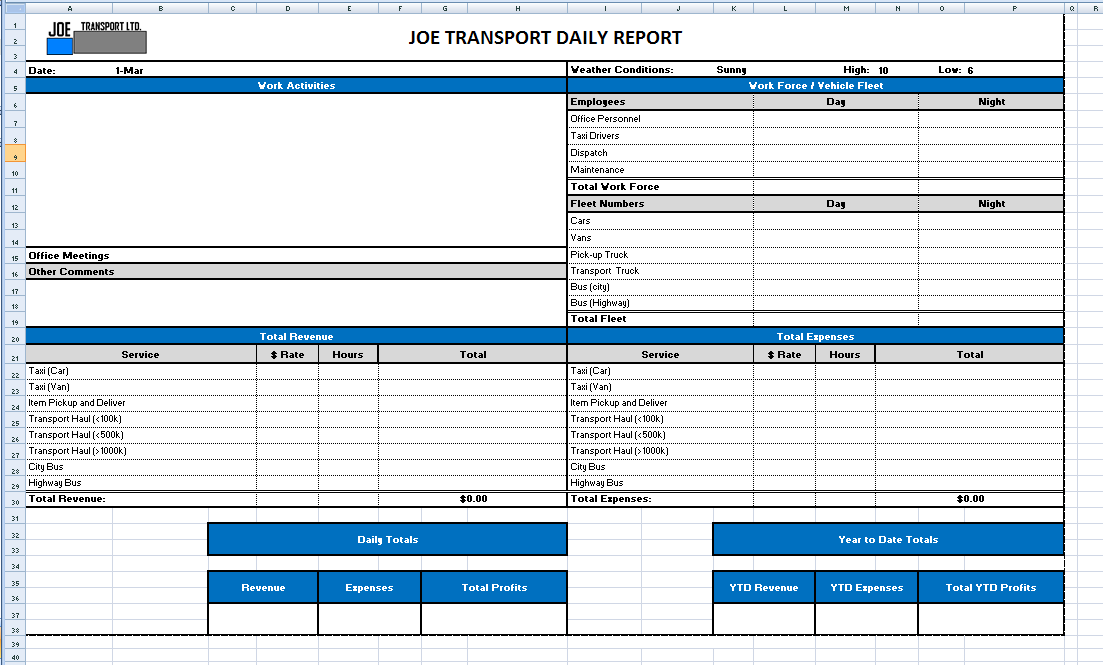
Here are some examples of professional reports that you can create in Excel:
- Financial statements
- Marketing reports
- Sales reports
- Project reports
- Research reports
Excel is a versatile tool that can be used to create a wide variety of professional reports. By following the tips in this article, you can create reports that are clear, concise, and well-written.


