Microsoft Excel: Mastering Pivot Tables
Pivot tables are a powerful tool in Microsoft Excel that allow you to summarize, analyze, and present large amounts of data in a clear and concise way. They are particularly useful for working with data that has multiple dimensions, such as sales data by product, region, and time period.
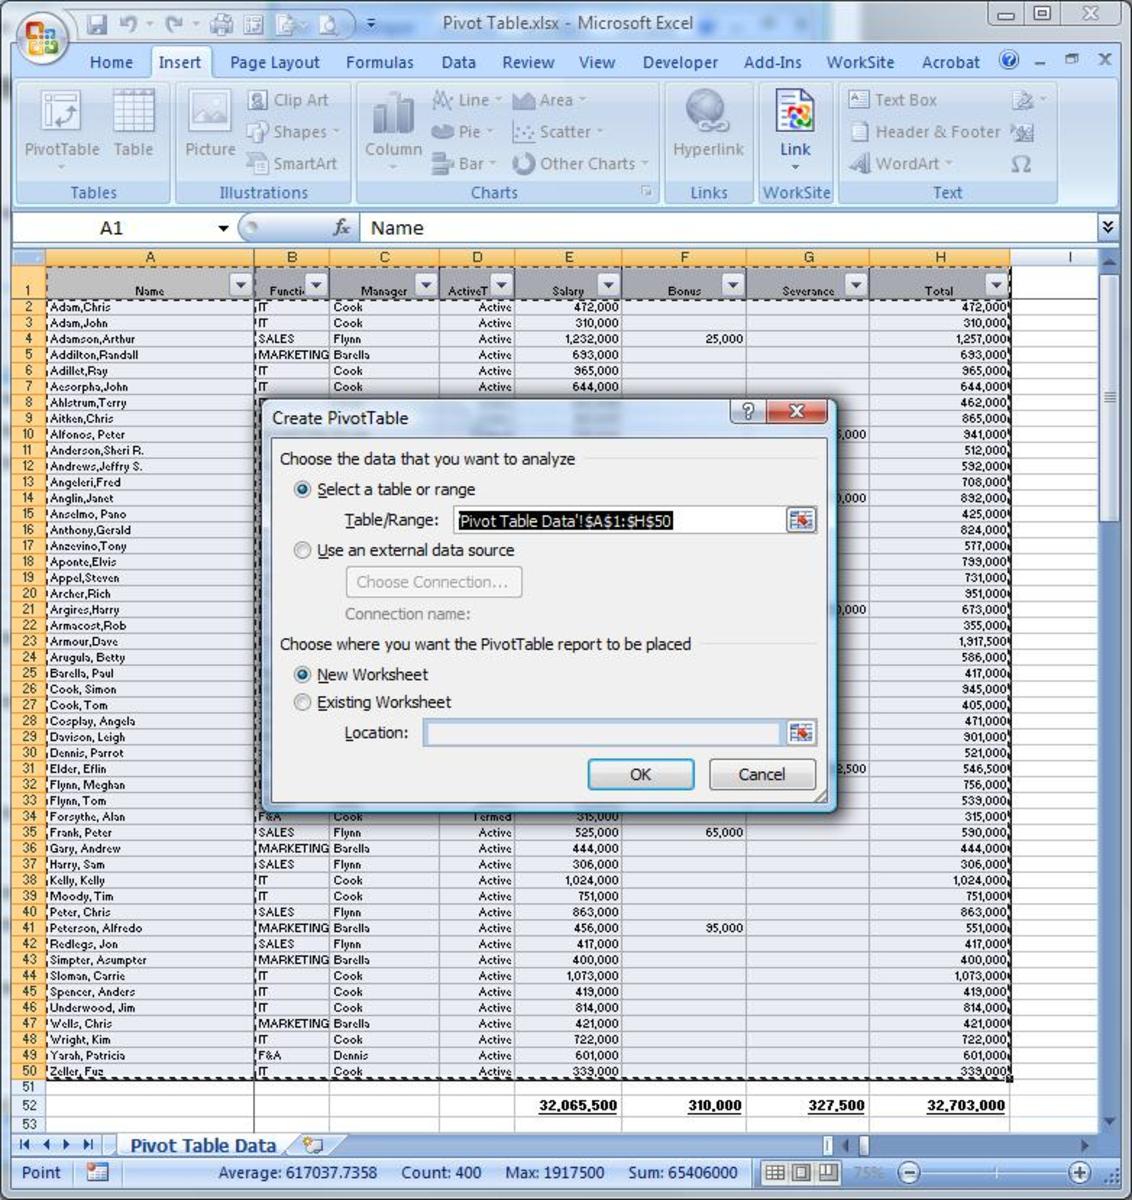
Creating a Pivot Table
To create a pivot table, select the data range you want to analyze. Then, click on the "Insert" tab and select "PivotTable". A new sheet will be created with an empty pivot table.
The PivotTable Fields pane will appear on the right-hand side of the screen. This pane contains the fields from the selected data range. You can drag and drop fields into the different areas of the pivot table to create your desired summary.
- Row Labels: These fields will be displayed as rows in the pivot table.
- Column Labels: These fields will be displayed as columns in the pivot table.
- Values: These fields will be used to calculate the summary values in the pivot table.
Customizing a Pivot Table
Once you have created a pivot table, you can customize it to suit your needs. You can change the layout, formatting, and calculation options.
- Layout: You can change the layout of the pivot table by dragging and dropping fields into different areas. You can also choose to show or hide subtotals and grand totals.
- Formatting: You can change the formatting of the pivot table by selecting the cells you want to format and applying the desired formatting options.
- Calculation Options: You can change the calculation options for the pivot table by right-clicking on the pivot table and selecting "PivotTable Options". In the "Calculation Options" tab, you can specify how the summary values are calculated.
Using Pivot Tables for Data Analysis
Pivot tables are a powerful tool for data analysis. You can use them to:
- Summarize data: Pivot tables can be used to quickly summarize large amounts of data. You can calculate totals, averages, and other summary statistics for any field in the data range.
- Analyze trends: Pivot tables can be used to analyze trends in the data. You can compare values over time, by region, or by any other field in the data range.
- Create visualizations: Pivot tables can be used to create visualizations of the data, such as charts and graphs. This can help you to see the data in a more visual way.
Conclusion
Pivot tables are a valuable tool for anyone who works with data in Excel. They can help you to summarize, analyze, and present data in a clear and concise way. By following the steps outlined in this article, you can master pivot tables and use them to get the most out of your data.