Microsoft Excel: Statistical Analysis Made Easy
Microsoft Excel is not only a spreadsheet software but also a powerful tool for statistical analysis. It offers a wide range of statistical functions that can simplify complex data analysis tasks.
Descriptive Statistics
Excel provides basic descriptive statistics such as mean, median, mode, standard deviation, and variance. These functions can help you summarize and understand the central tendencies and variability of your data.
Hypothesis Testing
Excel also enables you to perform hypothesis testing. Functions like TTEST, ANOVAA, and CORREL allow you to test hypotheses about the mean, variance, and relationships between variables.
Regression Analysis
Regression analysis is used to predict the value of a dependent variable based on one or more independent variables. Excel’s regression functions, such as LINEST and SLOPE, make it easy to fit linear and non-linear regression models.
Time-Series Analysis
Time-series analysis involves analyzing data over time. Excel’s time-series functions, like FORECAST and TREND, can help you predict future values and identify trends in your data.
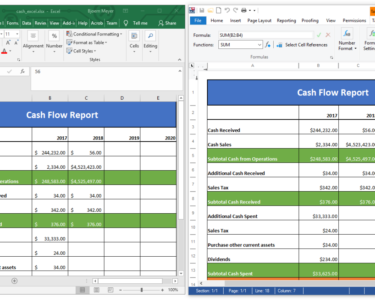
Data Visualization
Visualizing your data is crucial for understanding and presenting statistical results. Excel offers a variety of charts and graphs, such as histograms, scatter plots, and line charts, to help you visualize your data effectively.
Using Statistical Functions
To use statistical functions in Excel, follow these steps:
- Click on the "Formulas" tab.
- Select the statistical function you want to use.
- Enter the arguments for the function, such as the range of data or the hypothesized mean.
- Press "Enter" to display the result.
Examples
Here are a few examples of how you can use Excel for statistical analysis:
- Calculate the mean of a dataset: =AVERAGE(A1:A10)
- Perform a two-sample t-test: =TTEST(A1:A10, B1:B10, 1, 3)
- Fit a linear regression model: =LINEST(Y1:Y10, X1:X10)
- Predict future values in a time series: =FORECAST(A1:A10, 6)
Conclusion
Microsoft Excel is a versatile tool that makes statistical analysis accessible and efficient. By utilizing its statistical functions and visualization capabilities, you can analyze and interpret your data with confidence and make informed decisions.