Microsoft Excel: Demystifying Statistical Functions
Introduction
Microsoft Excel is a versatile tool that not only facilitates data management and analysis but also offers a comprehensive suite of statistical functions. Understanding these functions is crucial for extracting meaningful insights from data. This article aims to provide a clear explanation of the statistical functions available in Excel, empowering you to leverage them effectively.
Basic Statistical Functions
- AVERAGE: Calculates the arithmetic mean of a given data set.
- COUNT: Determines the number of non-empty cells within a range.
- MAX: Returns the highest value in a data set.
- MIN: Returns the lowest value in a data set.
- MEDIAN: Calculates the middle value in a data set when arranged in ascending or descending order.
- MODE: Identifies the most frequently occurring value in a data set.
Advanced Statistical Functions
- CORREL: Measures the linear relationship between two data sets.
- COVAR: Calculates the covariance between two data sets.
- DEVSQ: Determines the sum of squared deviations from the mean for a data set.
- LINEST: Performs linear regression and returns an array of coefficients describing the line of best fit.
- PERMUT: Calculates the number of possible arrangements of objects in a data set.
- QUARTILE: Returns the value at the specified quartile (e.g., first, second, third quartile) of a data set.
- STANDARDIZE: Standardizes data by converting it to a standard normal distribution (mean = 0, standard deviation = 1).
- STDEV: Calculates the standard deviation of a data set.
- STEYX: Estimates the standard error of the y-estimate in linear regression.
- VAR: Determines the variance of a data set.
How to Use Statistical Functions in Excel
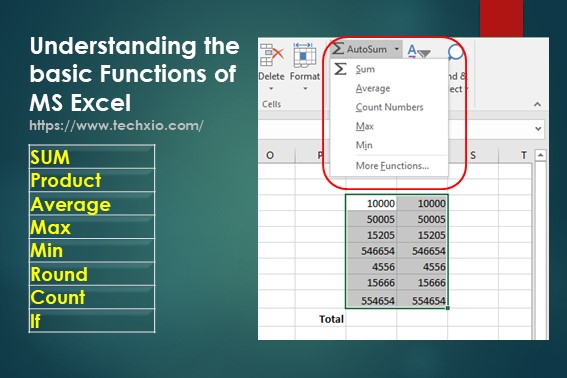
To use a statistical function in Excel, follow these steps:
- Select the cells containing the data you want to analyze.
- Go to the "Formulas" tab and select "More Functions."
- Click on the "Statistical" category.
- Choose the desired function and click "OK."
- Specify the cell ranges or values for the function’s arguments.
Applications of Statistical Functions
Statistical functions in Excel are invaluable for various applications, such as:
- Analyzing trends and patterns in data
- Making predictions and forecasts
- Comparing data sets
- Identifying outliers
- Conducting hypothesis testing
Conclusion
Mastering statistical functions in Microsoft Excel unlocks powerful tools for data analysis and decision-making. By understanding the basic and advanced functions available, you can extract meaningful insights from your data and make informed judgments. Whether you’re a researcher, analyst, or student, leveraging these functions will help you elevate your data analysis skills.