Basics of Creating Charts in Microsoft Word
Charts are a powerful tool for visualizing data and making it easier to understand. Microsoft Word makes it easy to create charts, and there are many different types of charts to choose from.
To create a chart in Microsoft Word:
- Click the "Insert" tab.
- Click the "Chart" button.
- Select the type of chart you want to create.
- Click the "OK" button.
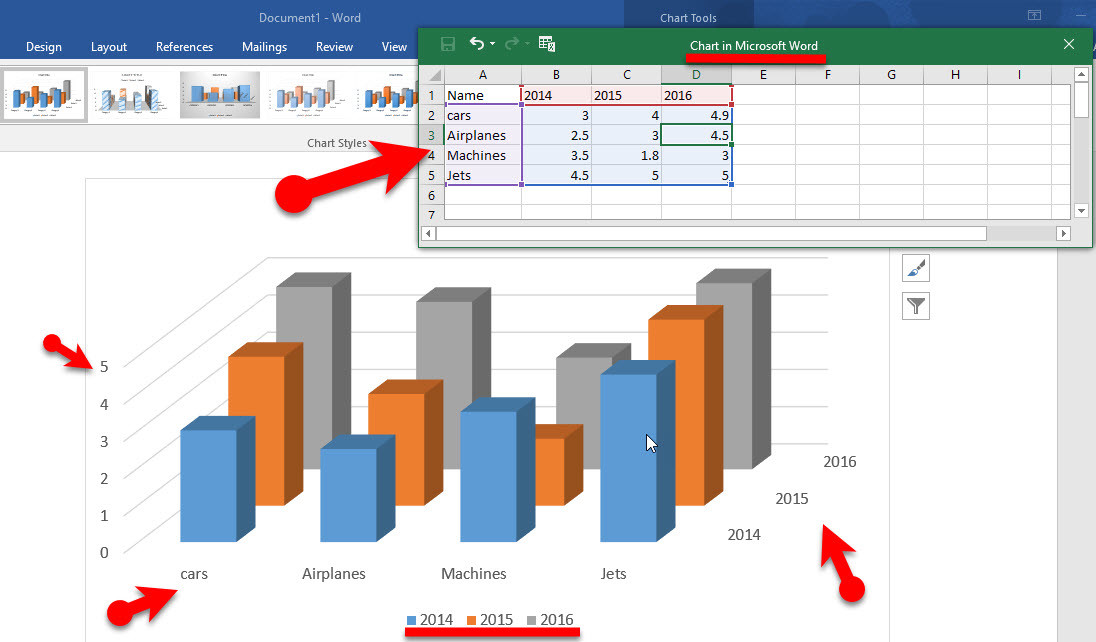
A chart will be inserted into your document. You can then edit the chart by clicking on it and selecting the "Chart Design" tab.
The Chart Design tab contains a variety of options for customizing your chart, including:
- Chart Type: You can change the type of chart by clicking on the "Chart Type" drop-down menu.
- Chart Style: You can change the style of your chart by clicking on the "Chart Style" drop-down menu.
- Data: You can edit the data in your chart by clicking on the "Data" tab.
- Layout: You can change the layout of your chart by clicking on the "Layout" tab.
Tips for creating effective charts:
- Use the right type of chart. There are many different types of charts, so it’s important to choose the one that best suits your data.
- Make your chart easy to read. Use a clear and concise font, and avoid using too many colors or patterns.
- Label your chart clearly. Make sure to include a title and labels for the axes.
- Use data that is relevant to your topic. Don’t include data that is not relevant to the point you’re trying to make.
Charts can be a powerful tool for communicating data. By following these tips, you can create effective charts that will help you make your point.