Microsoft Excel: Data Analysis Techniques
Microsoft Excel is a versatile software application that offers a wide range of data analysis capabilities. With its powerful tools and intuitive interface, Excel enables users to organize, manipulate, and analyze data efficiently to gain valuable insights and make informed decisions.
Data Import and Cleaning
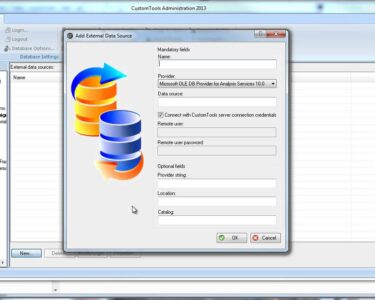
Before performing data analysis, it’s essential to import data into Excel and ensure its quality. Excel provides various options for importing data from different sources, such as CSV files, databases, and web pages. Once imported, the data can be cleaned to remove errors, inconsistencies, and duplicates. This step is crucial to ensure the accuracy and reliability of your analysis.
Data Manipulation
Excel provides a comprehensive set of data manipulation tools that allow users to transform and prepare their data for analysis. These tools include:
- Sorting: Arrange data in ascending or descending order based on specific criteria.
- Filtering: Display only relevant data based on specified conditions.
- Pivot Tables: Summarize and group large datasets to create interactive reports.
- VLOOKUP and HLOOKUP: Retrieve data from other worksheets or tables using specified criteria.
Statistical Analysis
Excel offers a range of statistical functions that enable users to perform descriptive and inferential statistical analyses. Some of the commonly used statistical functions include:
- Descriptive Statistics: Calculate measures of central tendency (mean, median, mode), variability (standard deviation, variance), and distribution (skewness, kurtosis).
- Hypothesis Testing: Conduct t-tests, z-tests, and chi-square tests to test hypotheses and make inferences about the data.
- Correlation and Regression Analysis: Examine the relationship between two or more variables using correlation and regression analysis.
Data Visualization
Effective data visualization is essential for presenting analysis results and communicating insights. Excel provides a variety of chart types, including bar charts, line charts, pie charts, and scatterplots, to help users visualize their data. These charts can be customized to enhance clarity and impact.
Scenario Analysis
Excel’s "What-If Analysis" feature allows users to explore different scenarios and see how changes in input values affect the outcome. This is particularly useful for forecasting and decision-making processes.
Example Use Cases
Data analysis techniques in Excel can be applied to a wide range of business and research applications, including:
- Market research and customer analysis
- Financial modeling and risk assessment
- Sales forecasting and inventory management
- Operations analytics and process improvement
Conclusion
Microsoft Excel is a powerful tool for data analysis that empowers users to organize, manipulate, and analyze data to gain valuable insights. Its intuitive interface, comprehensive data manipulation tools, statistical functions, and data visualization capabilities make it an essential tool for businesses, researchers, and analysts. By mastering these techniques, users can unlock the full potential of their data and make more informed decisions.


