Microsoft Excel: Spreadsheet Management Strategies
Microsoft Excel is a powerful spreadsheet program that can be used to manage large amounts of data. However, if you’re not careful, your spreadsheets can quickly become cluttered and difficult to manage. By following a few simple strategies, you can keep your spreadsheets organized and easy to use.
1. Use a consistent formatting style.
One of the best ways to keep your spreadsheets organized is to use a consistent formatting style. This means using the same font, font size, and cell alignment throughout your spreadsheet. It also means using consistent headings and subheadings to make it easy to find the information you’re looking for.
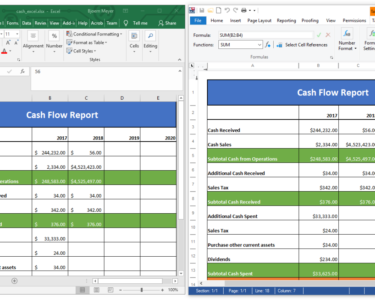
2. Use colors to highlight important data.
Colors can be a great way to draw attention to important data in your spreadsheets. For example, you could use red to highlight cells that contain errors or green to highlight cells that contain important information.
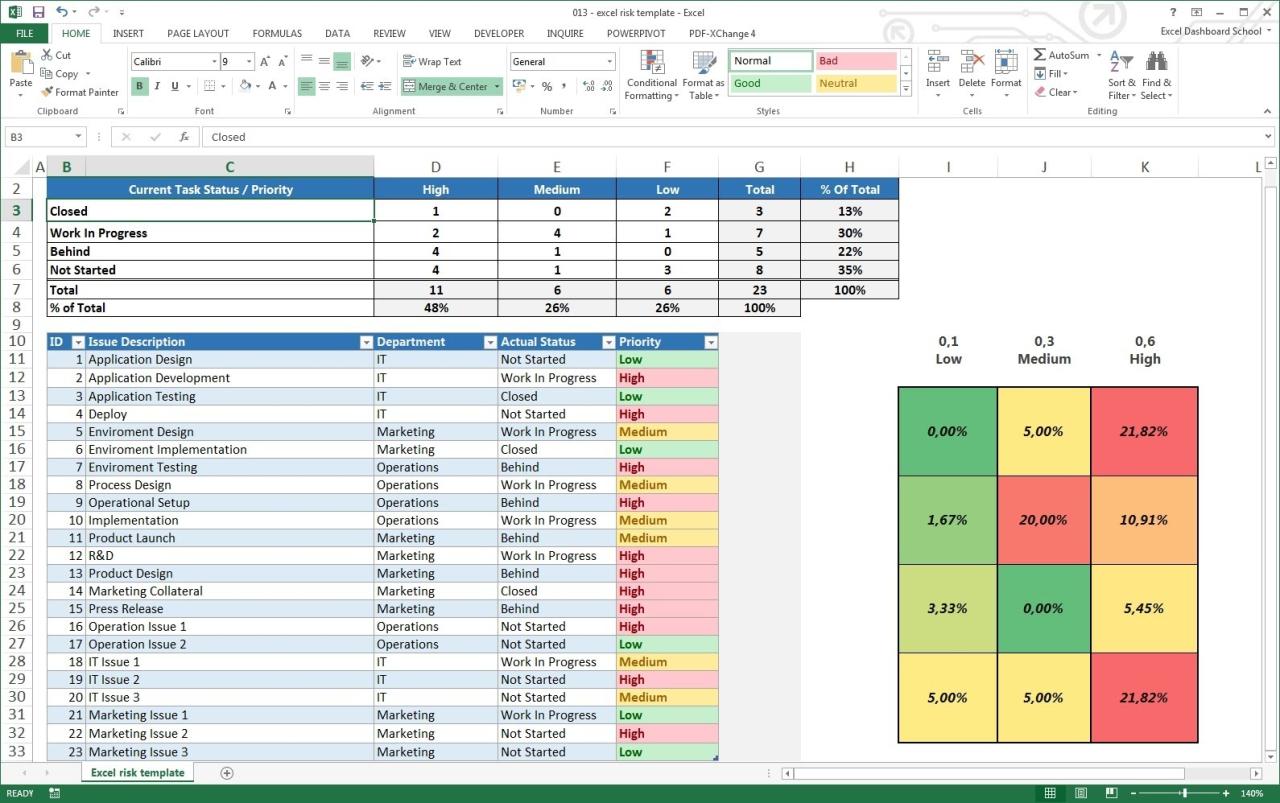
3. Use charts and graphs to visualize your data.
Charts and graphs can be a great way to visualize your data and make it easier to understand. For example, you could use a pie chart to show the distribution of data or a line chart to show trends over time.
4. Use formulas to automate calculations.
Formulas can be a great way to automate calculations in your spreadsheets. For example, you could use a formula to calculate the total of a column of numbers or to calculate the average of a range of cells.
5. Use filters to sort and filter your data.
Filters can be a great way to sort and filter your data so that you can focus on the information that you’re most interested in. For example, you could use a filter to show only the rows that contain a certain value or to show only the rows that meet a certain criteria.
6. Use pivot tables to summarize your data.
Pivot tables can be a great way to summarize your data and make it easier to analyze. For example, you could use a pivot table to show the total sales for each product or to show the average sales for each region.
7. Use macros to automate tasks.
Macros can be a great way to automate tasks in your spreadsheets. For example, you could use a macro to create a new spreadsheet or to print a spreadsheet.
By following these simple strategies, you can keep your spreadsheets organized and easy to use. This will save you time and frustration, and it will help you to make better use of your data.