Microsoft Excel: Step-by-Step Tutorials
Microsoft Excel is a powerful spreadsheet application that allows users to create, manage, and analyze data. It is widely used in various industries, including finance, accounting, data analysis, and more. This guide provides step-by-step tutorials to help you get started with Excel and master its essential features.
Getting Started with Excel
- Open Excel: Launch the Excel application from your Start menu or Applications folder.
- Create a New Workbook: Click on "File" > "New" to create a new blank workbook.
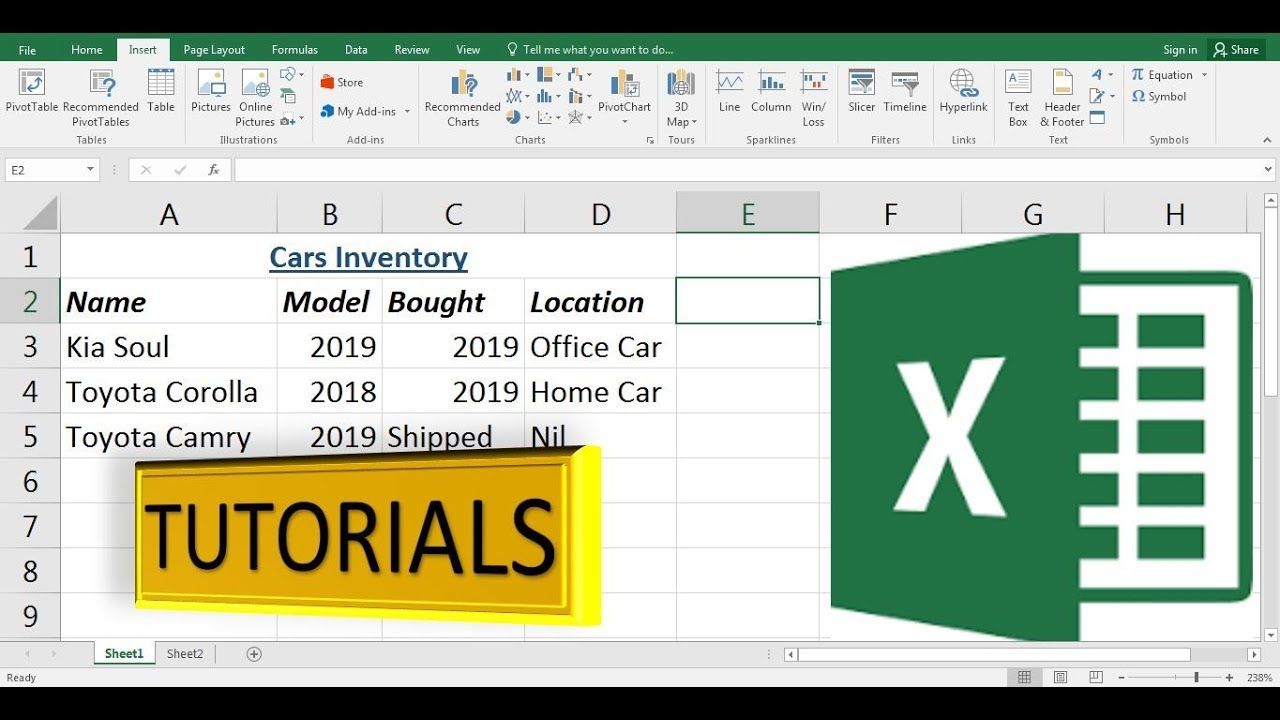
- Understand the Layout: The Excel workspace consists of a grid of cells, a formula bar, and a ribbon containing all the commands and tools.
Entering and Editing Data
- Enter Data: Click on a cell and begin typing to enter data. Use the Enter key to move to the next cell.
- Select Cells: Click and drag to select multiple cells. Right-click on selected cells to access context menus.
- Edit Data: Double-click on a cell to edit its contents. Use the formula bar to directly enter formulas or edit existing ones.
Formatting and Styling
- Change Font and Style: Select the cells you want to format and use the font options in the "Home" tab of the ribbon to change the font, size, and color.
- Apply Borders and Shading: Click the "Borders" and "Fill" options under the "Home" tab to add borders, patterns, or colors to cells.
- Merge and Center: Select multiple cells and click the "Merge & Center" button under the "Home" tab to combine them into a single cell with centered content.
Basic Calculations
- Use Arithmetic Operators: Enter arithmetic formulas using the operators +, -, *, and / in the formula bar to perform basic calculations.
- Use Cell References: Use cell references to refer to values in other cells. For example, =A1+B1 adds the values in cells A1 and B1.
- Apply Functions: Excel provides a wide range of built-in functions for various calculations. Use the "Insert Function" button under the "Formulas" tab to insert functions like SUM(), AVERAGE(), and COUNT().
Data Management
- Sort and Filter Data: Select the data and use the "Sort & Filter" options under the "Data" tab to sort or filter the data based on specific criteria.
- Create Tables: Convert data into a structured table for easier management. Tables allow you to quickly sort, filter, and apply formatting.
- Use PivotTables: Create interactive data summaries using PivotTables. They allow you to analyze and visualize data in different ways.
Data Analysis
- Create Charts: Use the "Insert" tab to create various types of charts such as bar charts, line charts, and pie charts.
- Use Conditional Formatting: Apply conditional formatting to cells based on specific conditions. This helps in visually identifying important data.
- Use Data Validation: Restrict users from entering invalid data into cells by setting data validation rules.
Conclusion
These step-by-step tutorials provide a foundation for working with Microsoft Excel. By following these instructions, you can learn the essential features and operations of Excel to effectively manage, analyze, and visualize data. With practice, you will become proficient in using Excel for a wide range of tasks.